
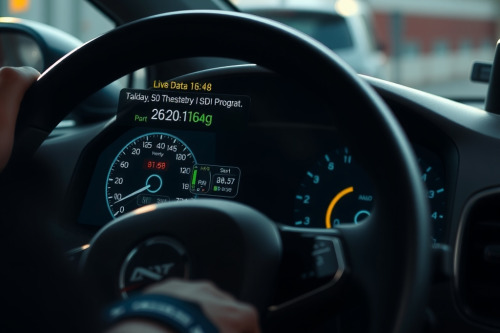
Relying solely on static trouble codes leads to misdiagnosis and unnecessary part replacement. In our workshop testing across hundreds of vehicles, freeze frames only show a snapshot while dynamic failures hide under transient load. Learning how to use live data for professional car diagnostics separates competent technicians from mere parts changers. Let's examine the telemetry streams that pinpoint root causes without guesswork.
Setting up telemetry and live data for professional car diagnostics
Data refresh rates drop when you poll 40 parameters at once. Modern controller area networks process requests sequentially, which dilutes your scan frequency. Target 4 to 6 critical channels to maintain an update speed above 15 frames per second.
Optimizing PID parameter identification and sample rate
Every scan tool processor has operational limits. When troubleshooting an intermittent misfire, deselect cabin climate control, tire pressure telemetry, and body control units. Focus exclusively on engine speed, calculated load, ignition timing, and cylinder misfire counters. High-speed volumetric efficiency calculations require maximum polling frequency. If your refresh rate drops below 10Hz, high-rpm transient events disappear completely from your log.
Interpreting fuel trim analysis under dynamic engine loads
Fuel trims expose how the engine control module compensates for unmetered air or delivery deficits. Normal operating limits typically hover within 5% positive or negative.
Fuel trim analysis across RPM ranges
Compare short-term fuel trim and long-term fuel trim across 2 distinct operational states: idle and 2500 RPM under load. When total fuel trim exceeds 10% positive at idle but corrects itself at 2500 RPM, you face a vacuum leak. Intake manifold gaskets or cracked vacuum lines pull unmetered air that decreases relative to total air volume at wider throttle openings. Conversely, trims that climb positive as engine speed rises point directly toward weak fuel pumps or restricted injectors.
Pinpointing intake restrictions via MAF sensor diagnostics
Mass airflow data provides the baseline figure for base injection timing and fuel delivery. A contaminated hot-wire sensor skews the calculated load without setting an immediate diagnostic code.
Execution of MAF sensor diagnostics
A healthy naturally aspirated engine at sea level draws roughly 1 gram per second of air per liter of engine displacement at idle. A 3.5L engine must show roughly 3.5 g/s at 650 RPM with accessories switched off. Take the vehicle through wide-open throttle in second gear up to the shift point. A functional sensor must report peak airflow within 10% of total calculated horsepower. If a 200 hp engine peaks at 140 g/s, the sensor element is degraded or contaminated with oil residue.
Evaluating sensor voltage threshold patterns on graphing tools
Digital readouts hide critical signal dropouts. Numerical displays show averaged figures, which masks millisecond ground dropouts or intermittent open circuits.
Analyzing an OBD2 scan tool graph
Convert your channel to an OBD2 scan tool graph to reveal hidden signal anomalies. Traditional upstream zirconia oxygen sensors must cycle between 0.1V and 0.9V at least 3 to 5 times every 10 seconds during closed-loop operation. If the transition time from rich to lean exceeds 100 milliseconds, the sensor is chemically poisoned. Wideband air-fuel sensors operate differently, holding steady current outputs near 0.0mA at stoichiometric balance. Graphing reveals signal hash that identifies degraded sensor ground paths immediately.
Leveraging live data for professional car diagnostics on test drives
Shop bay testing fails to recreate highway aerodynamic loads and torque converter lockup stresses. You must capture data under real road operating conditions.
Capturing sensor voltage threshold drops under full throttle
Configure manual triggers on your diagnostic tool before heading onto the road. Set the record marker to trigger when calculated load exceeds 85% or when knock retard registers higher than 2 degrees. Inspect your throttle position sensor voltage threshold simultaneously. The voltage curve should climb smoothly from 0.5V at closed throttle to 4.5V at full depression without jagged valleys or random dropouts. A brief dropout to 0V indicates worn conductive traces inside the potentiometer assembly.
Establishing a structured diagnostic workflow
Randomly hunting through hundreds of data lines wastes billable shop hours. Useful diagnostic execution requires a repeatable process based on fundamental mechanical principles.
Always verify basic mechanical integrity before trusting live sensor data. Check engine oil level, base fuel pressure, and battery terminal voltage before connecting your diagnostic tool. Low system voltage under 12.2V causes erratic analog-to-digital conversions inside the engine computer, generating false sensor spikes.
Deploy live data for professional car diagnostics on every difficult driveability issue to cut diagnostic times and avoid returning unfixed cars to customers. Connect your diagnostic platform, isolate the key operational channels, and record a baseline test drive right now.