
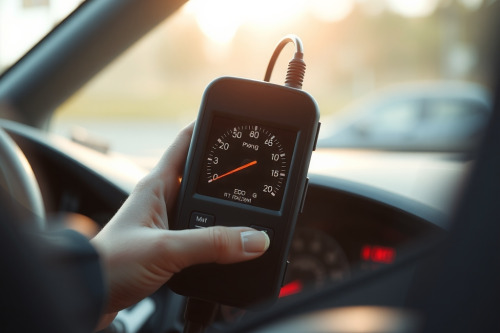
A glowing amber MIL on the instrument cluster costs you money the second the vehicle hits your stall. As a veteran flat-rate tech, I've seen too many rookies swap out functional parts simply because a code pointed them toward an oxygen sensor. Learning how to diagnose a check engine light with an OBD2 scanner requires looking past basic code clearing and digging straight into freeze frame records. Master the data stream on your screen, or you'll burn unbillable bay time chasing ghosts.
The Core Protocol to Diagnose a Check Engine Light With an OBD2 Scanner
Stop firing the parts cannon at a customer vehicle. Plucking an OBD2 scanner from your rolling cart and hooking it to the 16-pin DLC under the dash takes under 60 seconds. Establish a clean communication link with the powertrain control module before cycling the ignition to Important On, Engine Off (KOEO). Verify system voltage stays above 12.4V to prevent bogus network drops.
Read both active and pending codes right away. Generic diagnostic trouble codes starting with P0 tell an SAE-standardized story, whereas P1 codes point to OEM-specific logic. Write them down in order of priority. Stored codes provide the baseline symptom, but they don't prove component failure on their own.
Analyzing Freeze Frame Data Under Heavy Engine Load
Freeze frame data captures the exact operating parameters present when the ECM flagged the failure. If a code sets at 45 MPH under 2,200 RPM with engine coolant temperature at 92°C, duplicating those specific driving conditions is mandatory. You cannot confirm an intermittent glitch idling in a service bay.
Critical Freeze Frame Operating Parameters
- Calculated Engine Load: Normal idle load ranges between 15% and 25%. Numbers above 35% at idle suggest mechanical drag or a skewed sensor input.
- Engine Coolant Temperature (ECT): Verifies closed-loop fuel control status. Operating range must hit 88°C to 102°C on modern platforms.
- Vehicle Speed and Engine RPM: Tells you whether the failure triggered during cold-start warmup or highway cruising.
- Fuel System Status: Confirms if the ECM was running in Open Loop, Closed Loop, or Open Loop Fault due to sensor failure.
Reading Live Sensor Data Stream and Fuel Trims
Fuel trims expose the root cause of driveability issues faster than any visual check. Short term fuel trim responds instantly to real-time mixture swings, while long term fuel trim tracks learned adaptation over miles of driving. Total fuel trim combines these two values (STFT + LTFT). Total trim values exceeding +10% indicate a lean condition, while values below -10% signify an overly rich mixture.
Differentiating between a vacuum leak and a failing mass airflow sensor comes down to engine RPM. Vacuum leaks pull false air downstream of the throttle body, generating high positive trims (often +18% to +25%) at 750 RPM. Step on the throttle and hold 2,500 RPM. If total fuel trims plummet back toward 0%, you're dealing with unmetered vacuum air entering an unsealed intake manifold or broken PCV line. If fuel trims stay high or drift even leaner at higher revs, your fuel pump is starving under load or the MAF sensor over-reports air mass.
Tackling EVAP Codes and O2 Sensor Circuit Faults
Evaporative emission system leak codes like P0442 or P0455 cause endless headaches in every repair shop. Clearing the code without verifying purge valve sealing guarantees a comeback. Pull the purge line, command the purge solenoid closed using bidirectional controls on your diagnostic tool, and hook up a manual vacuum pump. The valve must hold 15 inches of vacuum indefinitely. A valve leaking even 1 inch of vacuum per minute will repeatedly flag minor leak DTCs.
Downstream oxygen sensors monitor catalytic converter efficiency. Upstream sensors control fueling. Graphing upstream sensor data tells you everything about combustion quality. A traditional zirconia sensor oscillates between 0.1V and 0.9V roughly twice per second in closed loop. If the signal flatlines near 0.2V, verify response by introducing propane into the intake; the voltage should spike instantly to 0.8V or higher. If testing advanced wideband air-fuel sensors, verify current output in milliamps or lambda targets rather than raw voltage.
Hardware Verification Before Busting Knuckles on Mechanical Teardown
Scan tools read processed serial data calculated by the computer. Sometimes the ECM gets lied to by damaged harnesses or compromised grounds. Before tearing into engine covers or dropping a fuel tank, break out an oscilloscope to check the raw signal integrity right at the sensor connector pin.
Avoiding Common Diagnostic Rabbit Holes
Technicians often lose two hours of flat-rate pay jumping directly to sensor replacement. Follow these verification benchmarks to protect your profitability:
- Ground Voltage Drop: Back-probe the sensor ground circuit to battery negative. Acceptable drop must read under 0.050V (50mV).
- Reference Voltage: The 5V reference line from the powertrain module must hold stable between 4.95V and 5.05V with the harness plugged in.
- Sensor Resistance: Compare bench resistance readings to factory repair specifications at 20°C before declaring a sensor dead.
- PCM Software Updates: Check OEM Technical Service Bulletins (TSBs) to make sure false DTCs aren't caused by outdated ECM calibration tables.
Steps to Diagnose a Check Engine Light With an OBD2 Scanner and Prevent Comebacks
Preventing comebacks separates a seasoned diagnostic tech from an amateur part-replacer. After completing a repair, you must reset the adaptation tables rather than simply wiping DTC memory. Clearing codes forces emissions monitors into an incomplete status, which leaves drive cycle testing unfinished.
Take the vehicle on an active road test matching the original freeze frame criteria. Run the vehicle through deceleration fuel cut-off, highway steady cruise, and hot idle until all OBD2 readiness monitors show "Ready". If the catalyst, evaporative, and oxygen sensor monitors set without pending DTCs returning, you solved the underlying failure.
Mastering Bay Workflow
Knowing how to diagnose a check engine light with an OBD2 scanner comes down to following strict diagnostic workflow rather than hunches. Read the code, freeze frame the failure state, graph fuel trims across load ranges, and verify signals at the wiring harness. Bring your scanner to the vehicle on every diagnostic ticket, trust your live data over guesswork, and execute every test methodically to keep your turnaround times fast and your bay clean.